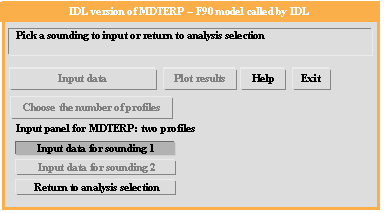
Figure 2a: Sounding input window, choosing the number of profiles from the pull-down menu.

Figure 2b: Sounding input window, click the "Input data for sounding 1" button to input data for sounding 1.

Figure 3: Sounding input window.

Figure 4: Main GUI window, clicking the "Compute results" button will compute results.

Figure 5: Main GUI window, selecting the spectrally integrated flux plot for sounding 1 from the "Select a plot" pull-down menu.

Figure 6: Plot window showing the spectrally integrated flux vs. altitude for sounding 1.

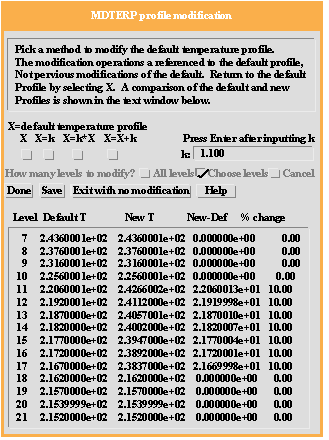
Supplementary figure 1: Profile modification window showing a 10% temperature increase in levels 11-17.

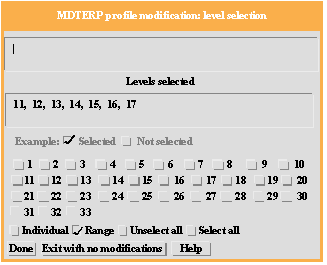
Supplementary figure 2: Level selection window showing levels 11-17 selected.