

The evaluation against ground observations is for the years 1996 to 2000. The satellite estimates come from:
GCIP/GAPP V1.0 (NOAA operational model output)
GCIP/GAPP V2.0 at 1/2 degree
GCIP/GAPP V2.1 at 1/2 degree
GCIP/GAPP V2.1 at 1/8th degree
The versions differ in cloud screening procedures only; the inference scheme is identical.
The ground truth comes from:
SURFRAD Network (4 stations are available during the entire period; two additional stations were added in July 1998) )
Arizona Meteological Network (AZMET) ( about 21 stations)
Illinois Climate Network ( 19 stations)
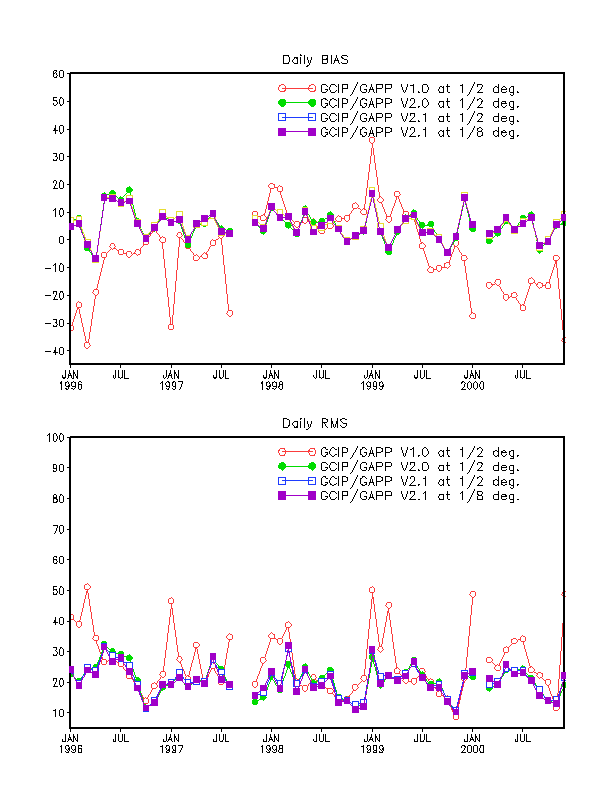
The results of the evaluation are presented in the following figures:
Figure 1. Hourly BIAS and RMS at SURFRAD stations (4 together)
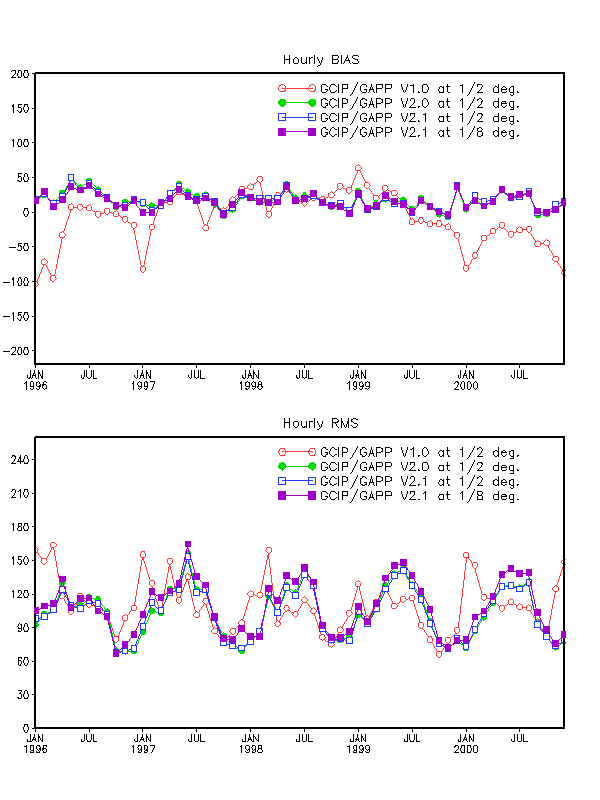
Figure 2. Daily BIAS and RMS at SURFRAD stations (4 together)
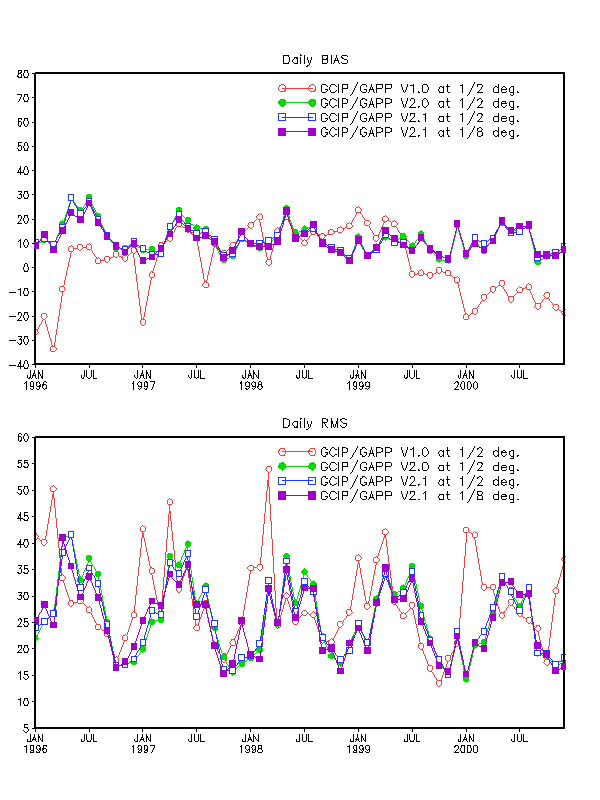
Figure 3. Hourly BIAS and RMS at ARZ stations (21 together)
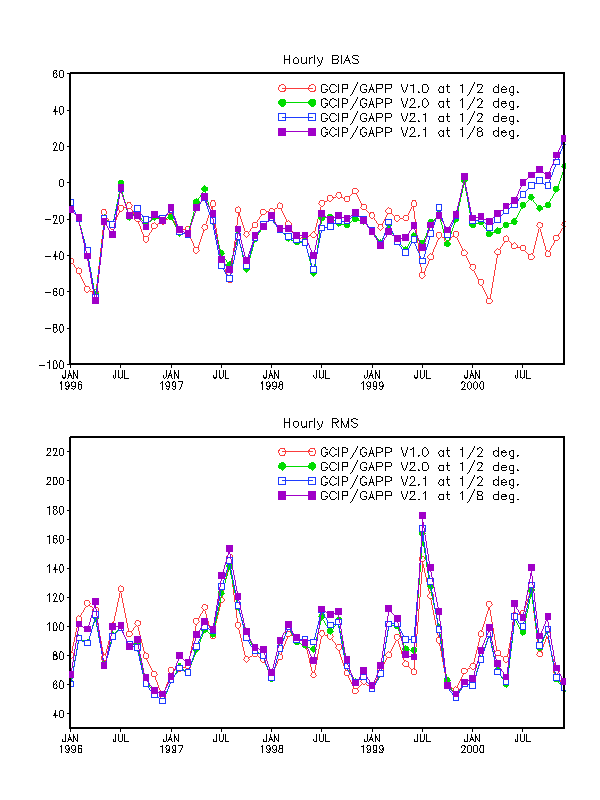
Figure 4. Daily BIAS and RMS at ARZ (21 together)
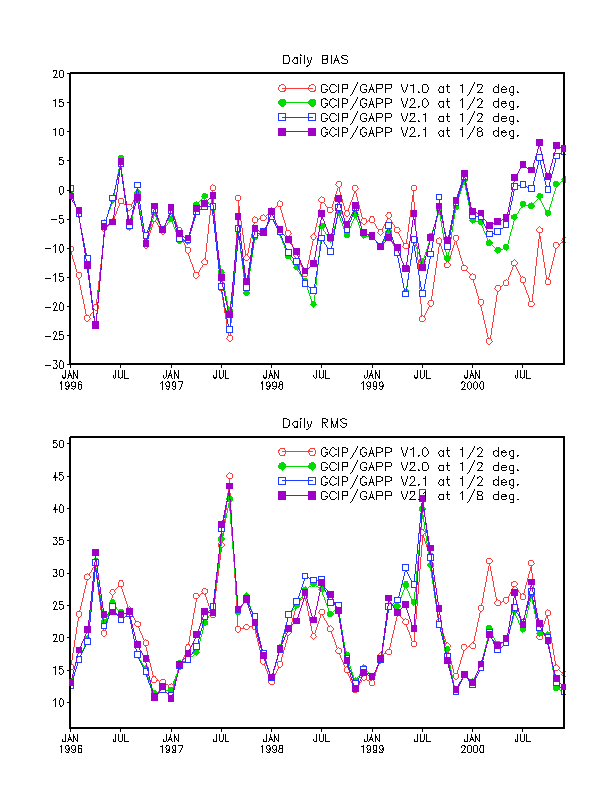
Figure 5. Hourly BIAS and RMS at ILL (19 together)
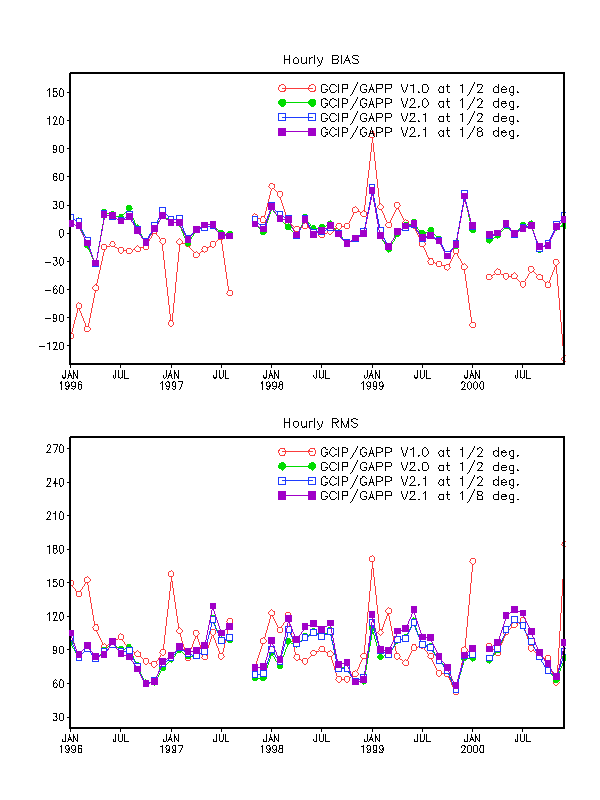
Figure 6. Daily BIAS and RMS at ILL (19 together)
** Note: The high RMS and BIAS in September 1997 is due to errors in ground truth during that month.
Figure 7. Hourly BIAS and RMS at Bondville, IL (SURFRAD)
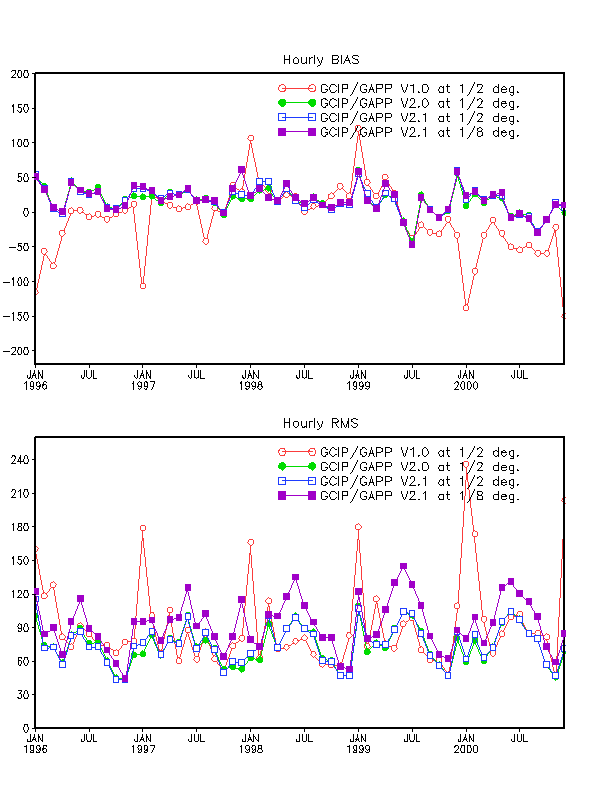
Figure 8. Hourly BIAS and RMS at Fort Peck, MT (SURFRAD)
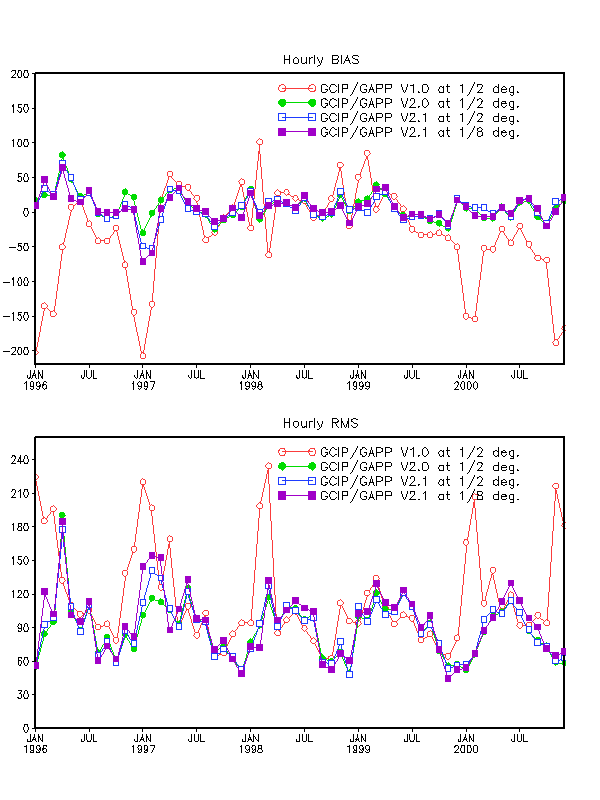
An improvement is evident during the winter months when compared to
the operational product. During the summer months, the two products are
in close agreement. The focus of current activity was on improving the
shortwave fluxes during the winter season.