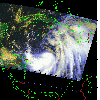
 2005 October 17 16:13 UT
NOAA-17 satellite AVHRR 3 channel color composite daytime image.
A closer view (224 Kb) is seen by clicking on this small image.
The maximum sustained winds are 45 mph.
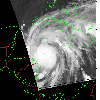 2005 October 19 02:58 UT
NOAA-17 satellite AVHRR channel 4 nighttime image.
A closer view (191 Kb) is seen by clicking on this small image.
The maximum sustained winds have increased to 100 mph.
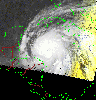 2005 October 19 11:37 UT
NOAA-15 satellite AVHRR 3 channel color composite early morning image.
A closer view (205 Kb) is seen by clicking on this small image.
The maximum sustained winds have increased to 175 mph. The central
pressure was 882 hPa at 1200 UT, marking the lowest pressure ever
recorded in an Atlantic hurricane.
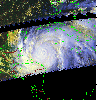 2005 October 19 20:13 UT
NOAA-16 satellite AVHRR 3 channel color composite daytime image.
A closer view (267 Kb) is seen by clicking on this small image.
The maximum sustained winds have decreased to 165 mph.
 2005 October 20 16:32 UT
NOAA-17 satellite AVHRR 3 channel color composite daytime image.
A closer view (207 Kb) is seen by clicking on this small image.
The maximum sustained winds have decreased to 145 mph.
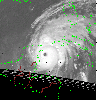 2005 October 21 08:26 UT
NOAA-16 satellite AVHRR channel 4 nighttime image.
A closer view (202 Kb) is seen by clicking on this small image.
The maximum sustained winds have increased to 150 mph.
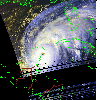 2005 October 21 19:49 UT
NOAA-16 satellite AVHRR 3 channel color composite daytime image.
A closer view (234 Kb) is seen by clicking on this small image.
The maximum sustained winds have decreased to 140 mph.
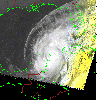 2005 October 22 12:06 UT
NOAA-15 satellite AVHRR 3 channel color composite morning image.
A closer view (228 Kb) is seen by clicking on this small image.
The maximum sustained winds have decreased to 120 mph.
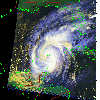 2005 October 22 15:46 UT
NOAA-17 satellite AVHRR 3 channel color composite daytime image.
A closer view (272 Kb) is seen by clicking on this small image.
The maximum sustained winds have decreased to 115 mph.
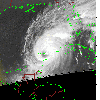 2005 October 22 23:27 UT
NOAA-15 satellite AVHRR channel 4 nighttime image.
A closer view (184 Kb) is seen by clicking on this small image.
The maximum sustained winds have decreased to 100 mph.
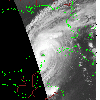 2005 October 23 03:07 UT
NOAA-17 satellite AVHRR channel 4 nighttime image.
A closer view (197 Kb) is seen by clicking on this small image.
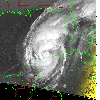 2005 October 23 11:42 UT
NOAA-15 satellite AVHRR channel 4 early morning image.
A closer view (232 Kb) is seen by clicking on this small image.
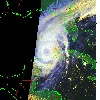 2005 October 23 15:24 UT
NOAA-17 satellite AVHRR 3 channel color composite daytime image.
A closer view (224 Kb) is seen by clicking on this small image.
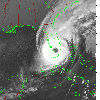 2005 October 24 11:18 UT
NOAA-15 satellite AVHRR channel 4 early morning image.
A closer view (270 Kb) is seen by clicking on this small image.
The maximum sustained winds have increased to 120 mph.
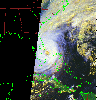 2005 October 24 15:01 UT
NOAA-17 satellite AVHRR 3 channel color composite daytime image.
A closer view (228 Kb) is seen by clicking on this small image.
The maximum sustained winds have decreased to 105 mph.
Another view
(342 Kb) shows Wilma beginning to absorb the circulation of TS Alpha lying to
its east.
 2005 October 24 16:41 UT
NOAA-17 satellite AVHRR 3 channel color composite daytime image.
A closer view (221 Kb) is seen by clicking on this small image.
 2005 October 24 22:39 UT
NOAA-15 satellite AVHRR channel 4 nighttime image.
A closer view (250 Kb) is seen by clicking on this small image.
The maximum sustained winds have increased to 120 mph.
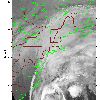 2005 October 24 02:24 UT
NOAA-17 satellite AVHRR channel 4 nighttime image.
A closer view (237 Kb) is seen by clicking on this small image.
The maximum sustained winds have increased to 125 mph.