|
Collaborative Research Atlantic Air-Sea fluxes from satellites, their variability and analysis of ocean models Department of Atmospheric and Oceanic Science University of Maryland, College Park |
Understanding why oceanic heat flux estimates differ
| Background | |
|
|
Approach |
|
|
Data Sets Used |
|
|
Results |
|
|
Available Data |
|
|
Publications |
|
|
Outreach Activity |
|
|
Acknowledgements |
|
|
Contacts |
|
|
References |
| Back to Front Page | |
|
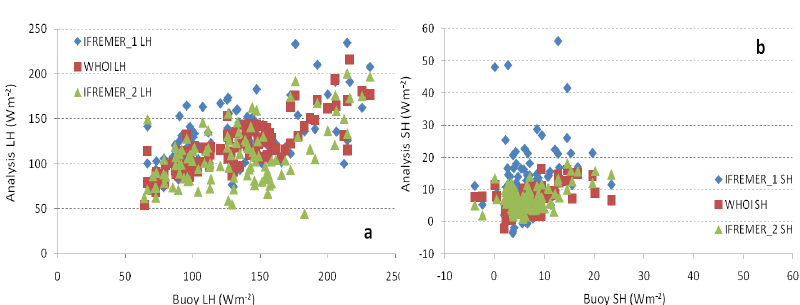
An in depth comparison between the French Research Institute for Exploitation of the Sea (IFREMER)* heat flux estimates with those from Woods Hole Oceanographic Institution (WHOI)** was performed. One is based on satellite observations and the other one, on a combination of inputs from assimilation of remotely sensed, buoy and ship data, and numerical analyses. The study focuses on the Atlantic sector (70°W-30°E, 45°S-45°N) during 1996-2005 for daily, monthly, and annual time scales The fluxes as well as the parameters that enter the
bulk formulae are evaluated against buoy observations from the Prediction
and Research Moored Array in the Atlantic (PIRATA; data as available at
http://www.pmel.noaa.gov/pirata/); since WHOI uses PIRATA
observations to adjust errors in its flux estimates, we also use
independent data
from three buoy experiments that are not used in assimilation by WHOI.
These are: FETCH (the "flux, etat de la mer, et teledetection
en conditions de fetch variable"), the Baltic Sea Swell Experiment
(BASE), and ROMEO, which was part of a field program off the North Carolina
coast of the United States. It is shown that the differences in latent
heat flux estimates are likely due to differences in specific humidity
used in deriving these two products while those in sensible heat flux
are likely due to differences in air temperature (Figure 1) (Santorelli
et al., 2011).
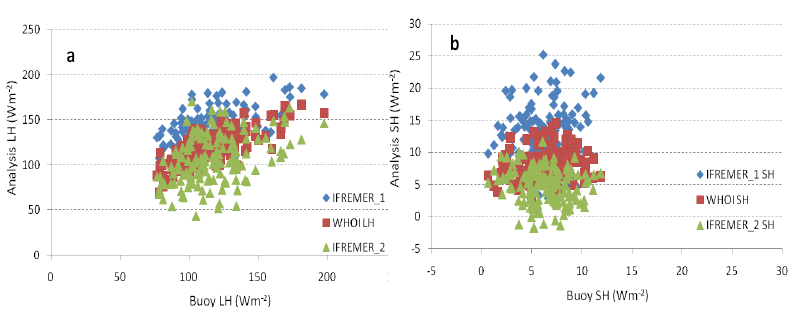
Experiments were conducted with satellite based estimates of specific
air humidity and air temperature (Jackson et al. (2006, 2009)) in
the IFREMER approach based on the COARE3.0 algorithm. Resulting estimates
of latent and sensible heat fluxes at two buoy locations from the PIRATA
array (12°N, 38°W and 4°N, 38°W) are illustrated (Figures
2 and 3). This resulted in significant improvements in both sensible and latent heat estimates by
the IFREMER method.
*http://cersat.ifremer.fr/layout/set/print/news/products_informations/new_release_of_satellite_turbulent_fluxes_1992_2007 These two products were selected due to availability of daily values. Note: IFREMER_1 denotes results from the original IFREMER approach; IFREMER_2 denotes results from IFREMER_1 when temperature and humidity are replaced with values from Jackson et al. (2009). |
||||||
|
|


