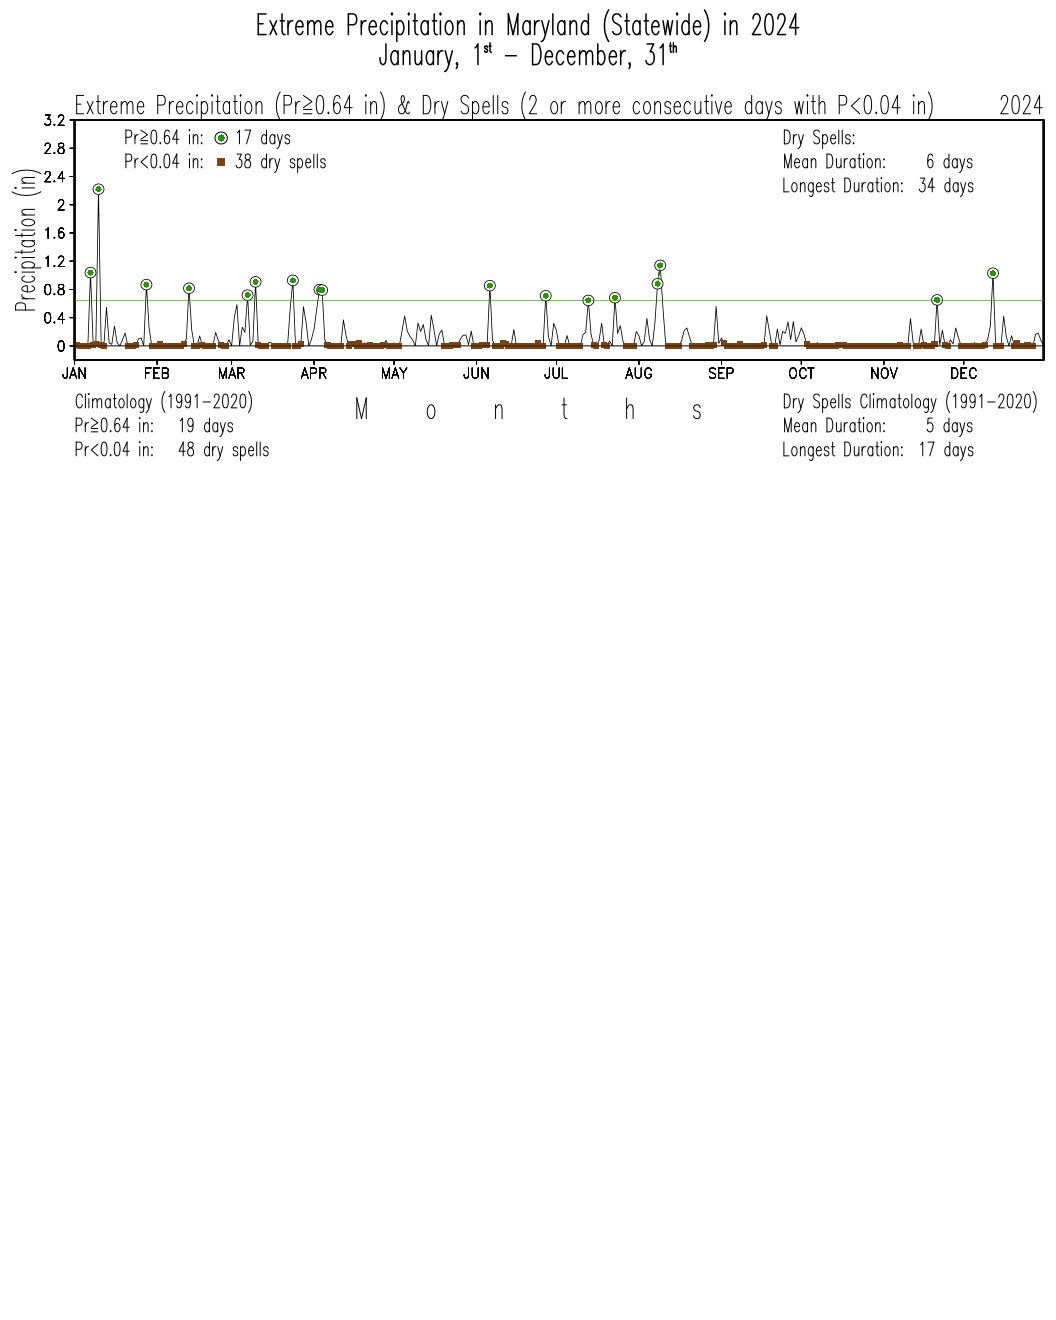
Area-averaged Extreme Precipitation & Dry Spells in
Maryland: 1 January - 31 December, 2024
This analysis identifies Days with Extreme Precipitation as those whose daily accumulated precipitation is equal or larger than the 95 percentily of daily precipitation in the period 1951-2000; and Dry Spells as those whose daily accumulated precipitation is equal or lower than 0.04 inches for at least two consecutuve days. Summary tables can be seen in the following links for Extreme Precipitation, and Dry Spells.
NOTE: The plots are created from preliminary NCEI's nClimDiv-Daily data set, v1.0.0. Data labeled as scaled on January 10, 2025.

The green horizontal line in each panel marks the extreme precipitation threshold.